Trace every hop. Watch every flow.
PingRoute combines traceroute and real-time ping telemetry into one fast, native app — multi-flow tabs, split-screen comparison, jitter and packet loss visualization, all running locally.
| Hop | IP | Name | Last | PL% |
|---|---|---|---|---|
| 1 | 192.0.2.1 | mynetwork.home | 1.0ms | 0% |
| 2 | 192.0.2.254 | Unknown | 7.0ms | 0% |
| 5 | 198.51.100.17 | Unknown | 12.0ms | 0% |
| 8 | 198.51.100.201 | Unknown | 16.0ms | 0% |
| 11 | 203.0.113.42 | Unknown | 6.0ms | 0% |
| 12 | 203.0.113.113 | example.com | 6.0ms | 0% |
A closer look
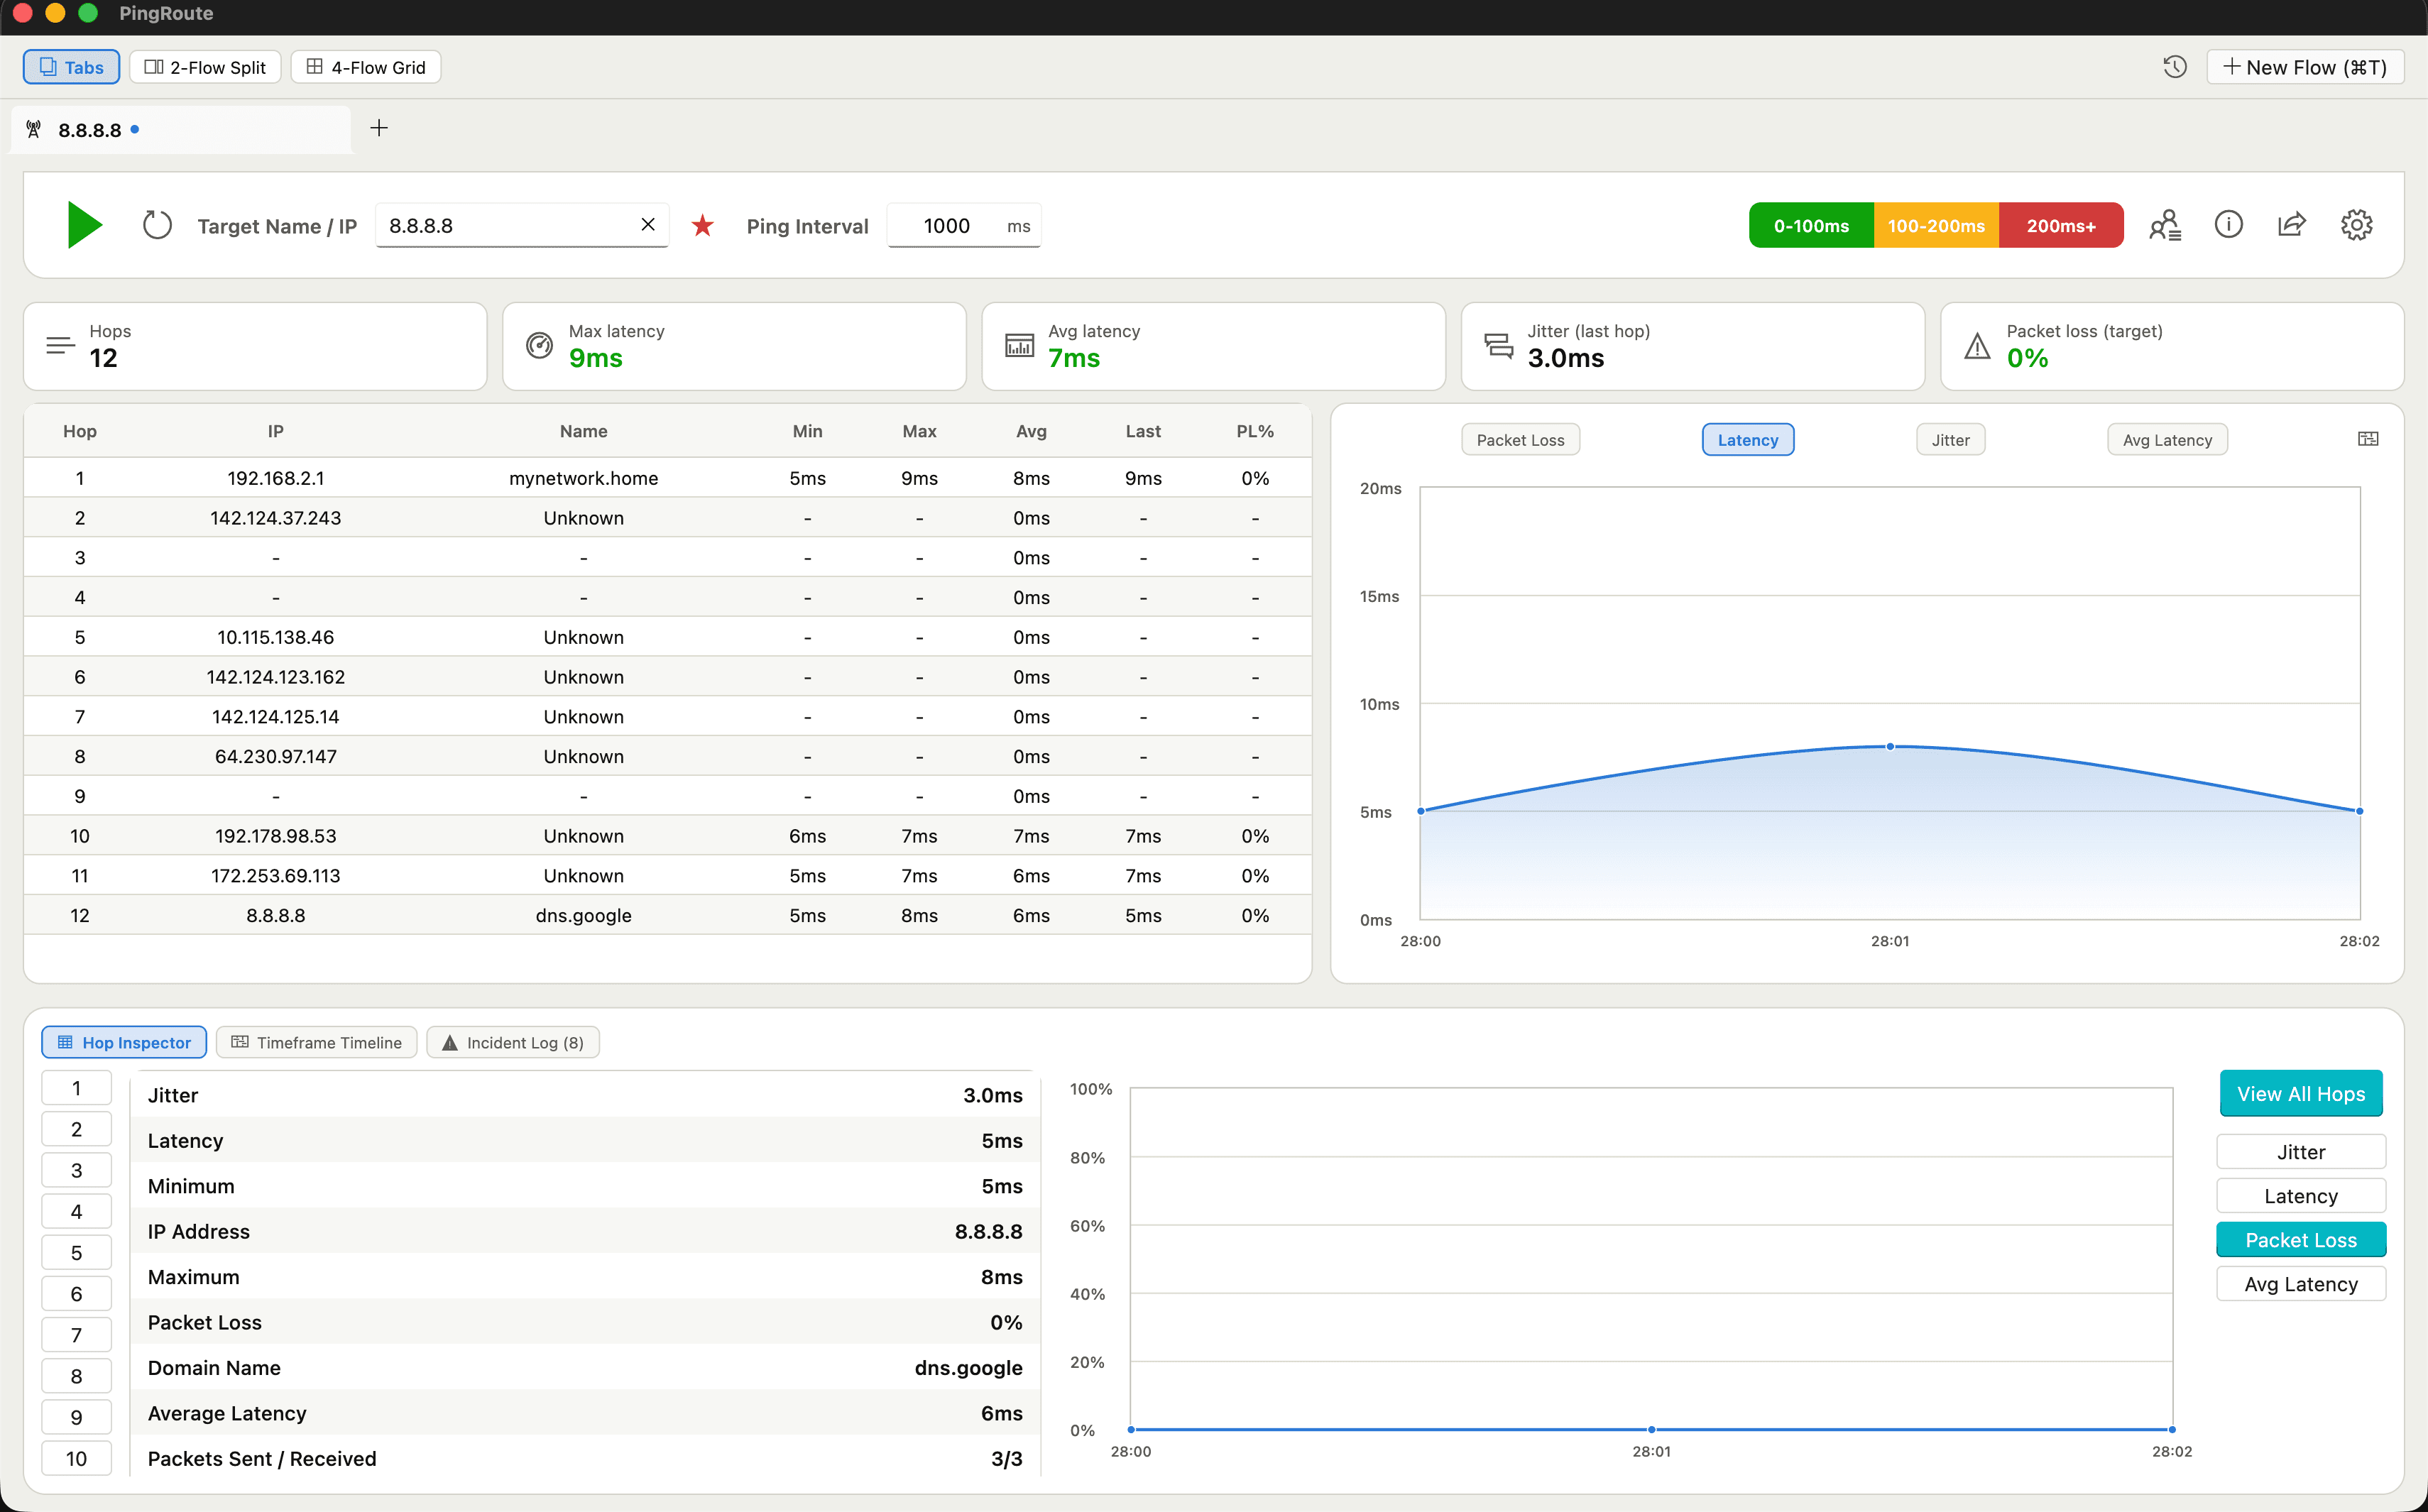
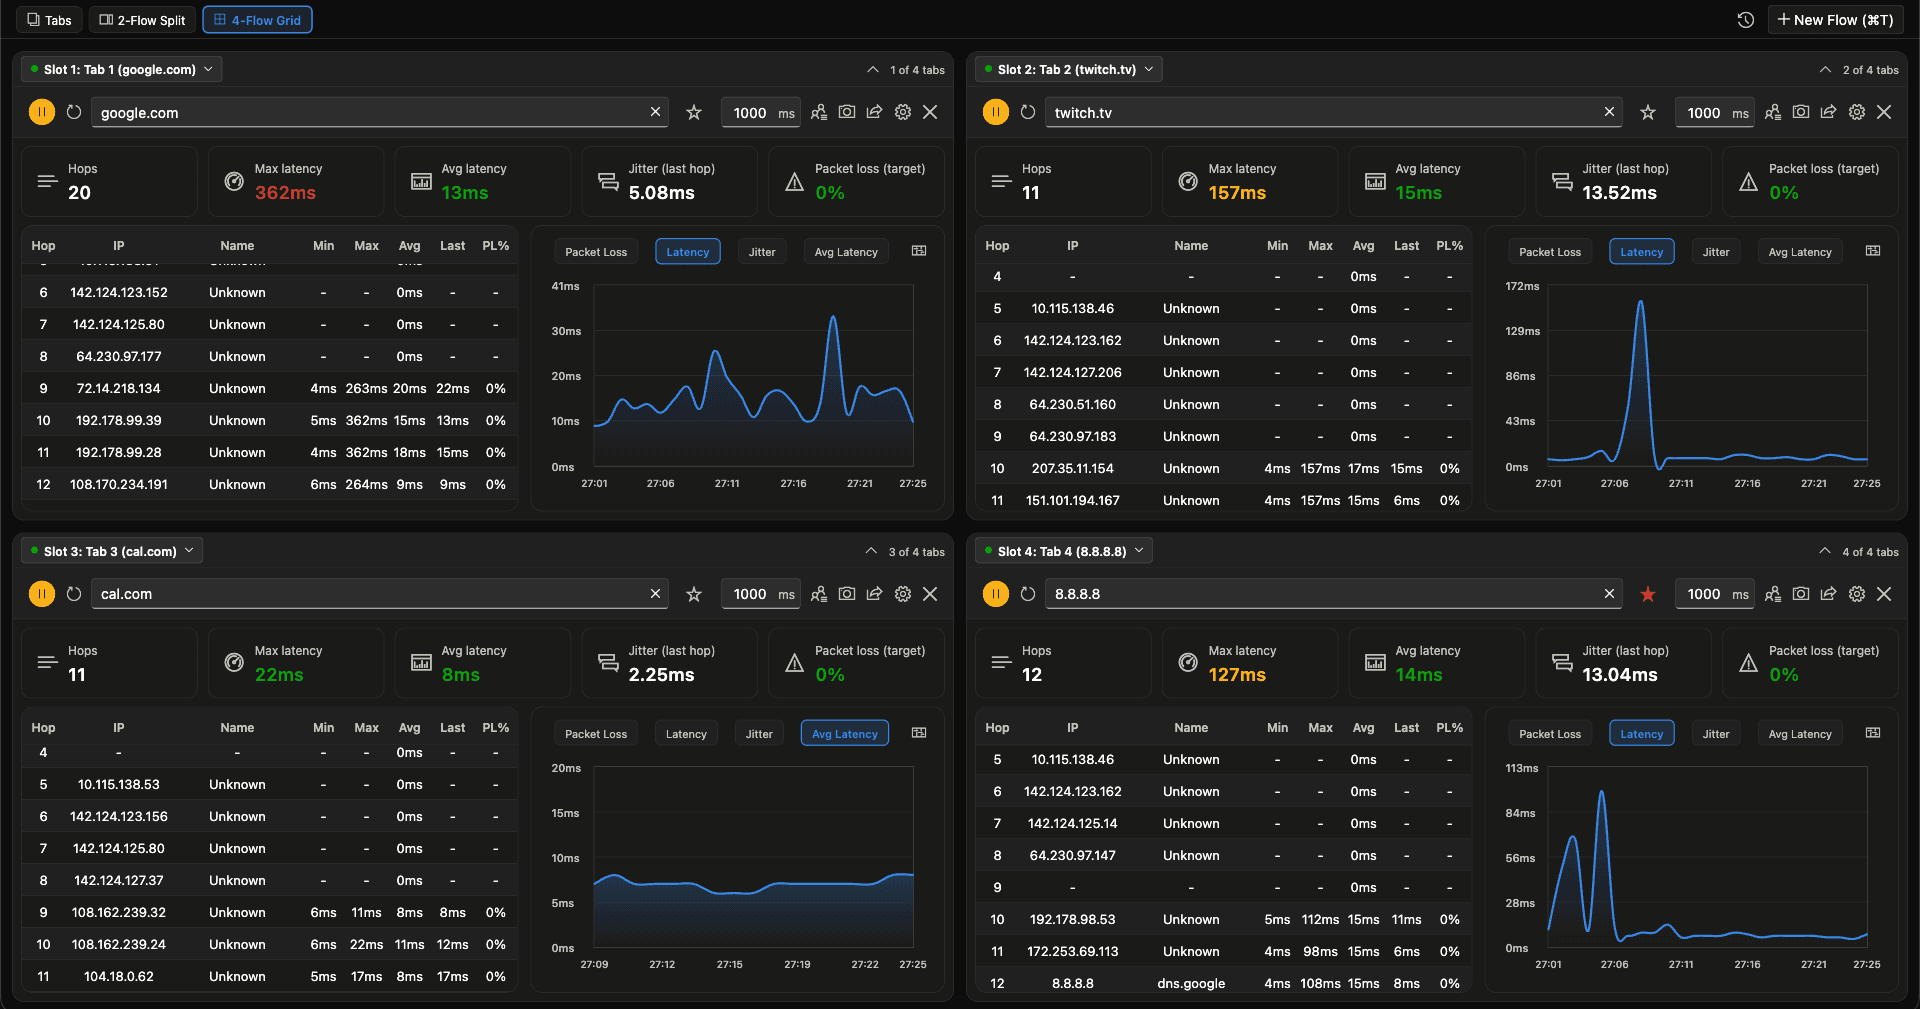
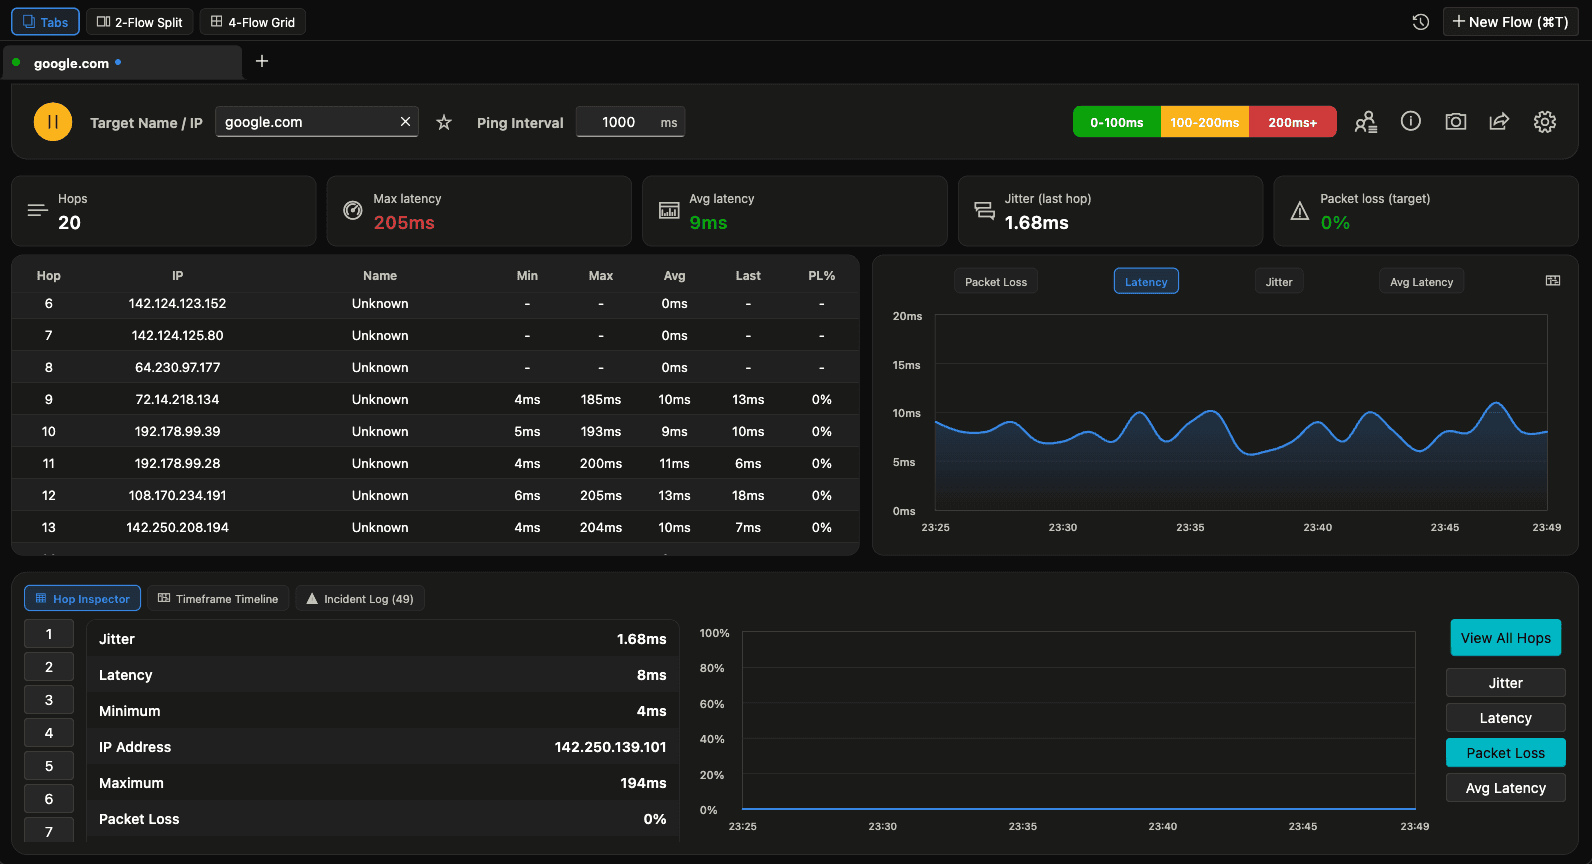
Real screens from the real app — the detail is in the hop tables, not the marketing copy.
Built for people who read hop tables for fun
Every feature is designed around one workflow: watch multiple network paths at once, and understand exactly where they break.
Multi-Flow & Multi-Tab
Run multiple independent traceroute and ping flows across different targets simultaneously. Add, close, switch, duplicate, or rename flow tabs with keyboard shortcuts.
Split & Grid Views
Compare routes side-by-side in a 2-flow split view, or monitor four targets at once in a 2x2 grid. Assign any open flow to any pane, and see per-slot status at a glance.
Real-Time Hop Telemetry
Live Min, Max, Avg, Last latency, and Packet Loss % for every hop along the route, with sortable columns and smart IPv4 ordering.
Stat Overview Cards
Hop count, max latency, average latency, jitter, and packet loss surfaced as glanceable cards above every flow, color-coded by severity.
Interactive Visualizations
Animated charts for latency, packet loss, jitter, and average latency, switchable per flow, with a fullscreen chart view.
Hop Inspector
Select any hop to see its full metric breakdown — jitter, latency, min/max, domain name, and packets sent/received — alongside a per-hop trend chart.
From zero to trace in seconds
No accounts, no config files — open the app and start probing.
Install
Grab it from the Microsoft Store or build from source for macOS and Linux.
Enter a target
Type a hostname or IP, set your ping interval, and press start.
Watch it trace
Hops populate live with min/max/avg/last latency and packet loss.
Compare & export
Split, grid, inspect a hop, or export the run as CSV, JSON, or ASCII.
More than a terminal command
traceroute and ping are the foundation — PingRoute is the workspace built around them.
| Capability | PingRoute | mtr | traceroute + ping |
|---|---|---|---|
| Multiple targets at once | Up to 4 in a grid | One terminal per target | One target |
| Live charts (latency, jitter, loss) | Text graph only | ||
| Per-hop min/max/avg/last | Varies | ||
| Split-screen comparison | |||
| Saved target directory | |||
| Export CSV / JSON / ASCII | Varies | Text only | |
| Native GUI app | |||
| Local-only, no telemetry | |||
| Free & open source | Varies |
PingRoute doesn't replace mtr or traceroute — it wraps the same probing techniques in a multi-flow GUI.
Keyboard-first
Every core action has a shortcut, so flow management never interrupts the data.
Built in the open, LGPL-2.1 licensed
Every line of PingRoute is on GitHub. There's no telemetry to audit because there isn't any — probing happens locally, and the code is there to prove it.
Built with
Ready to trace your network?
Free, open source, and 100% local. No account, no subscription, no catch.