Everything you need to diagnose a network
PingRoute goes past a single traceroute — it's a workspace for watching many routes at once and understanding exactly where they degrade.
Multi-Flow & Multi-Tab Architecture
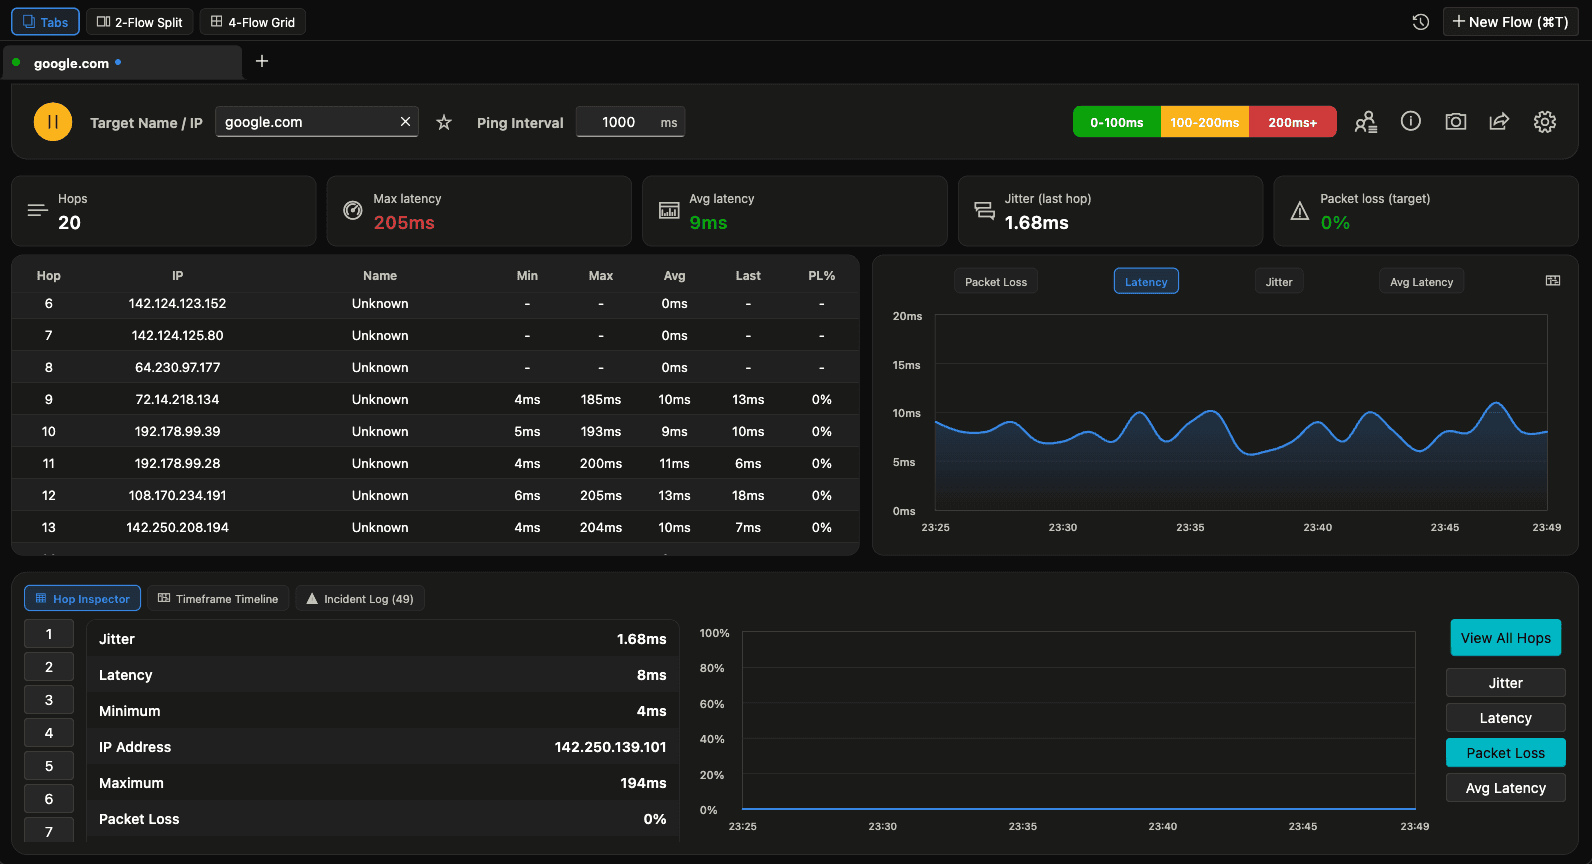
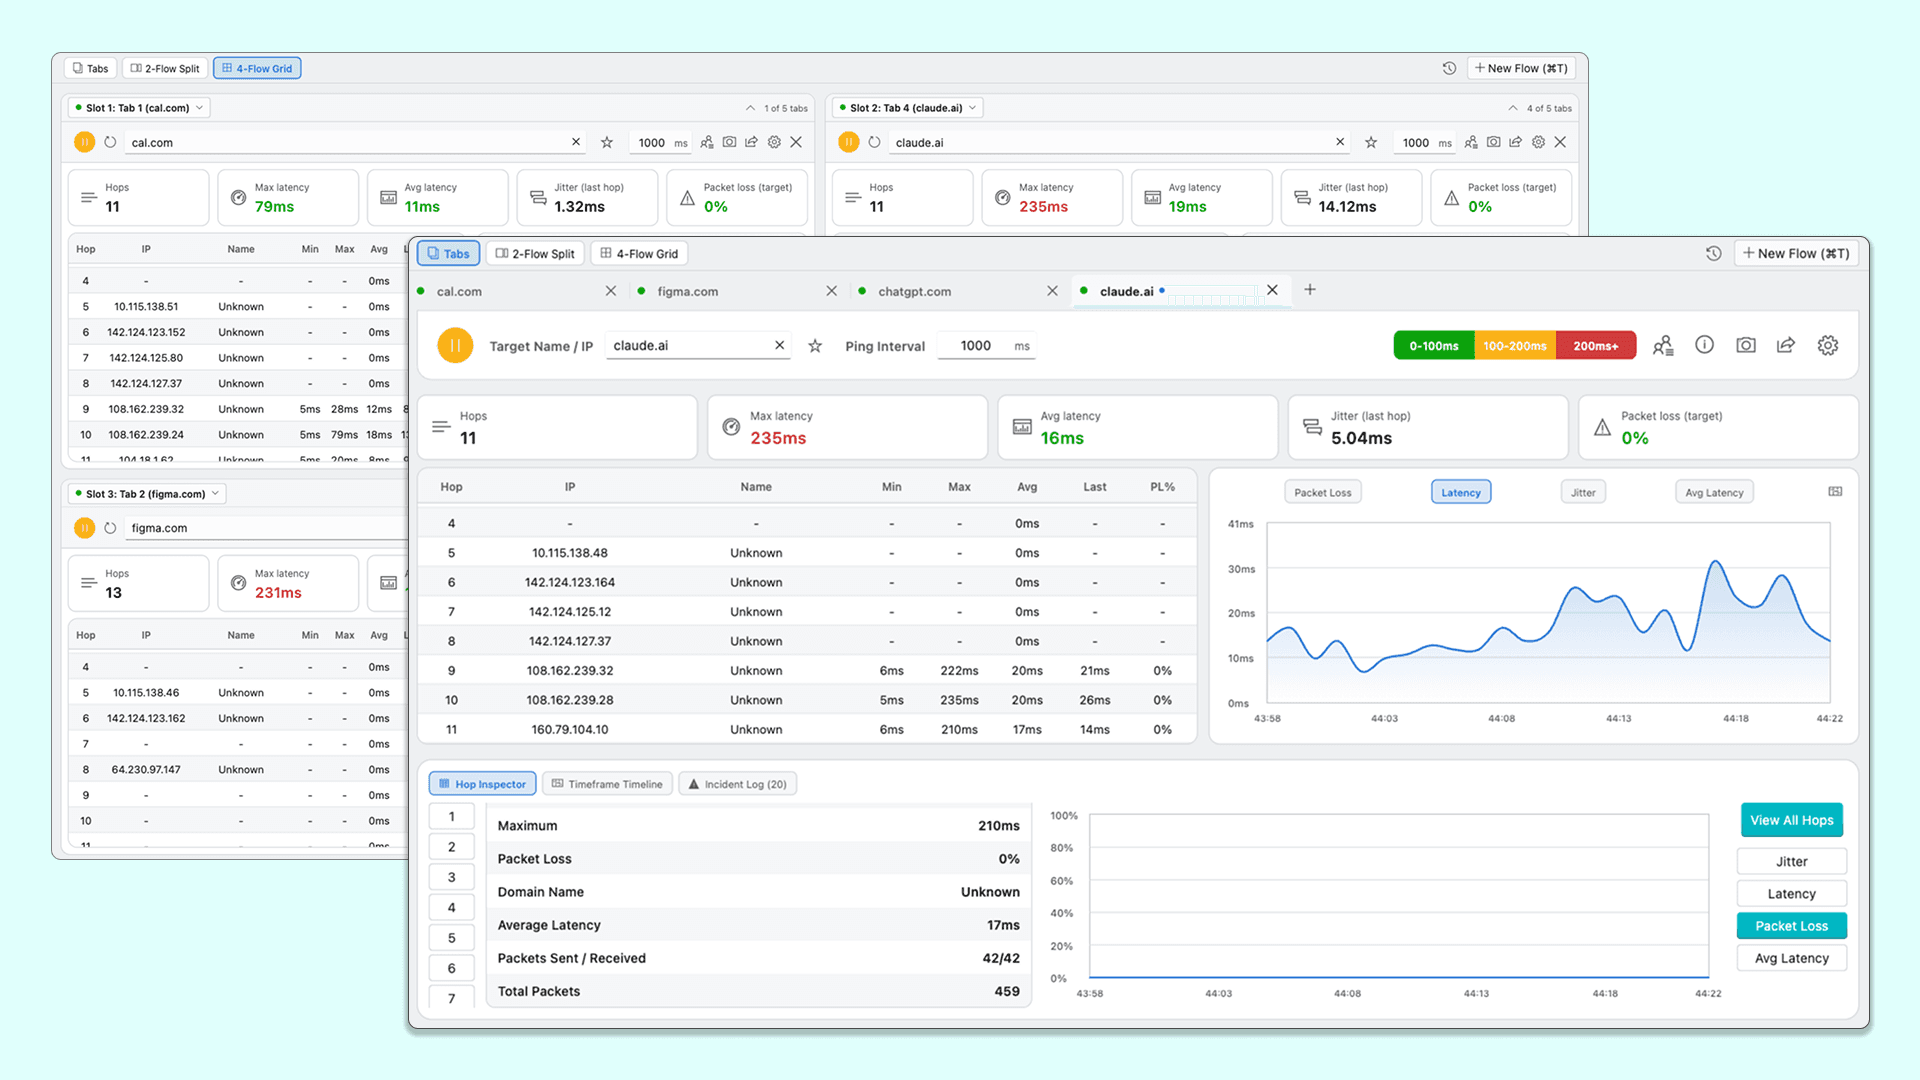
Run multiple independent traceroute and ping flows against different targets at the same time. Add a tab with Cmd/Ctrl+T, close it with Cmd/Ctrl+W, jump straight to flow 1–9, duplicate, or rename — the tab bar is built for juggling a dozen targets without losing track.
Split & 4-Flow Grid Views
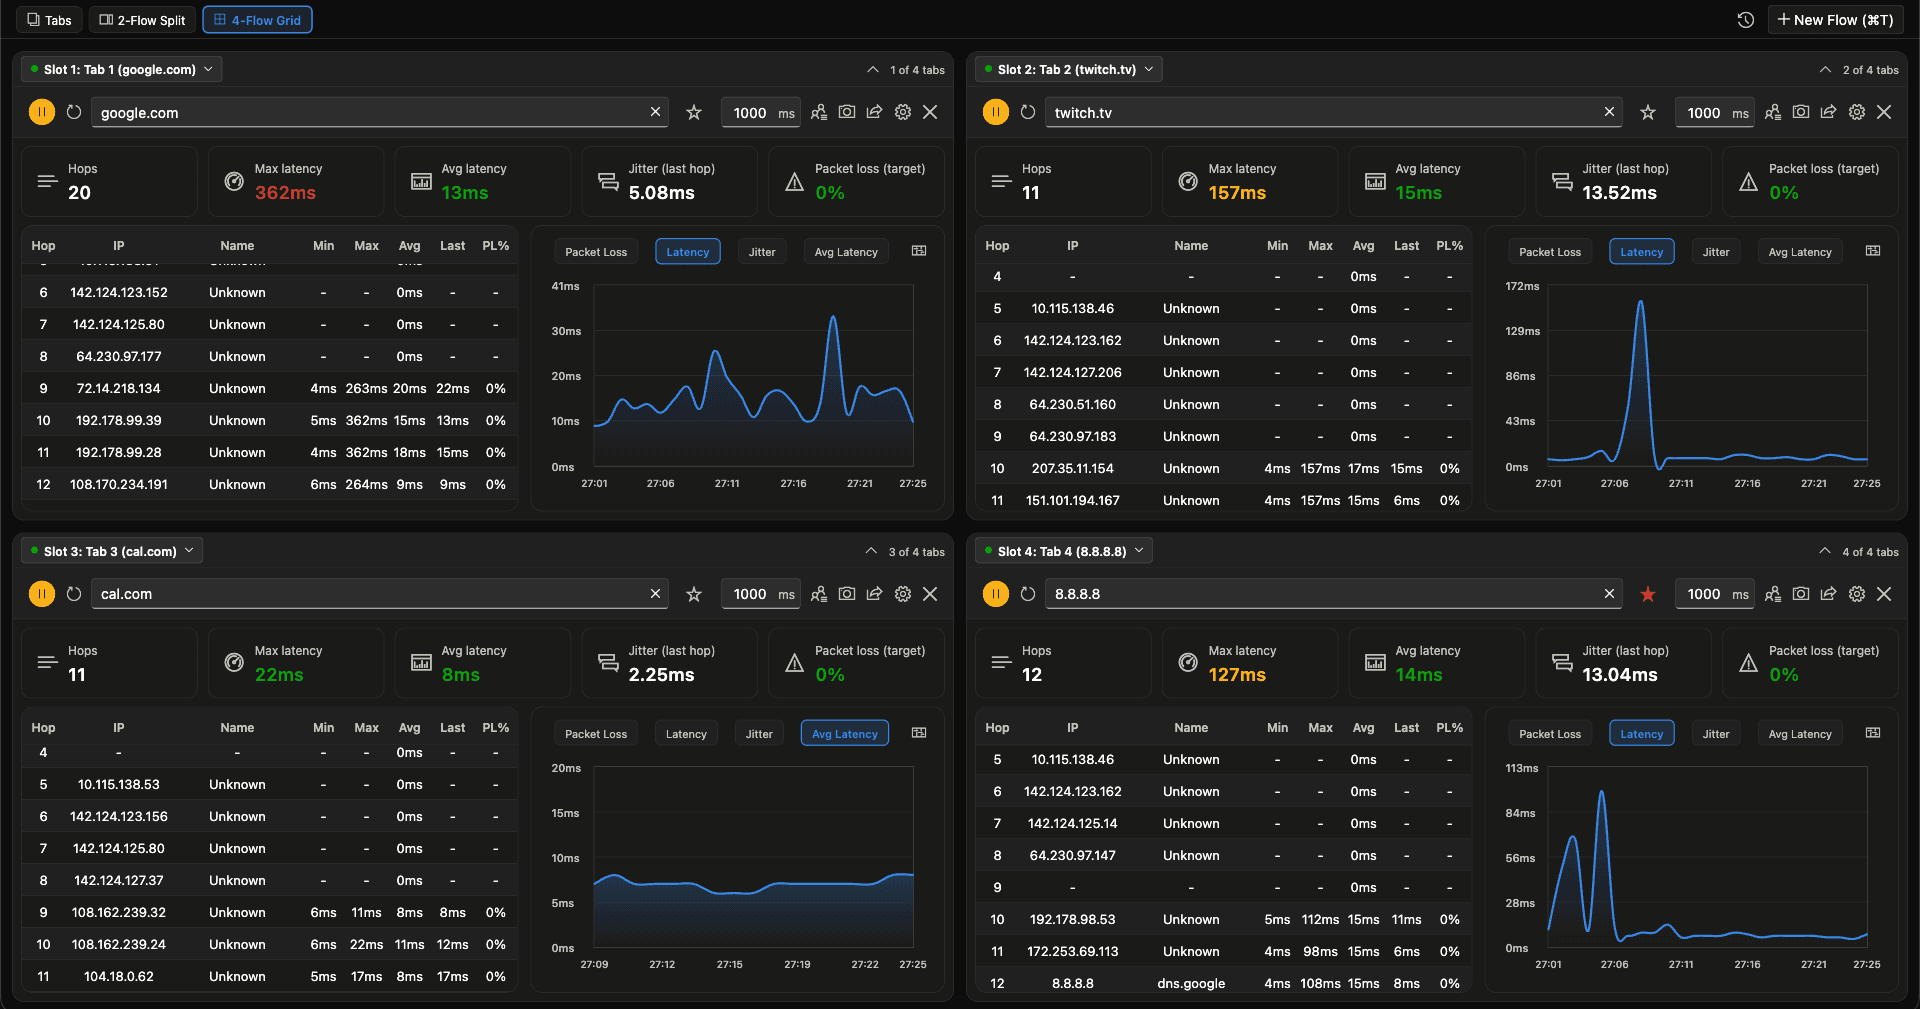
Switch between a focused single-tab view, a 2-flow side-by-side split for A/B comparisons, or a full 2x2 grid to watch four targets at once. Any open flow can be assigned to any pane through the slot dropdown, and each pane shows its own live status.
Real-Time Hop Telemetry
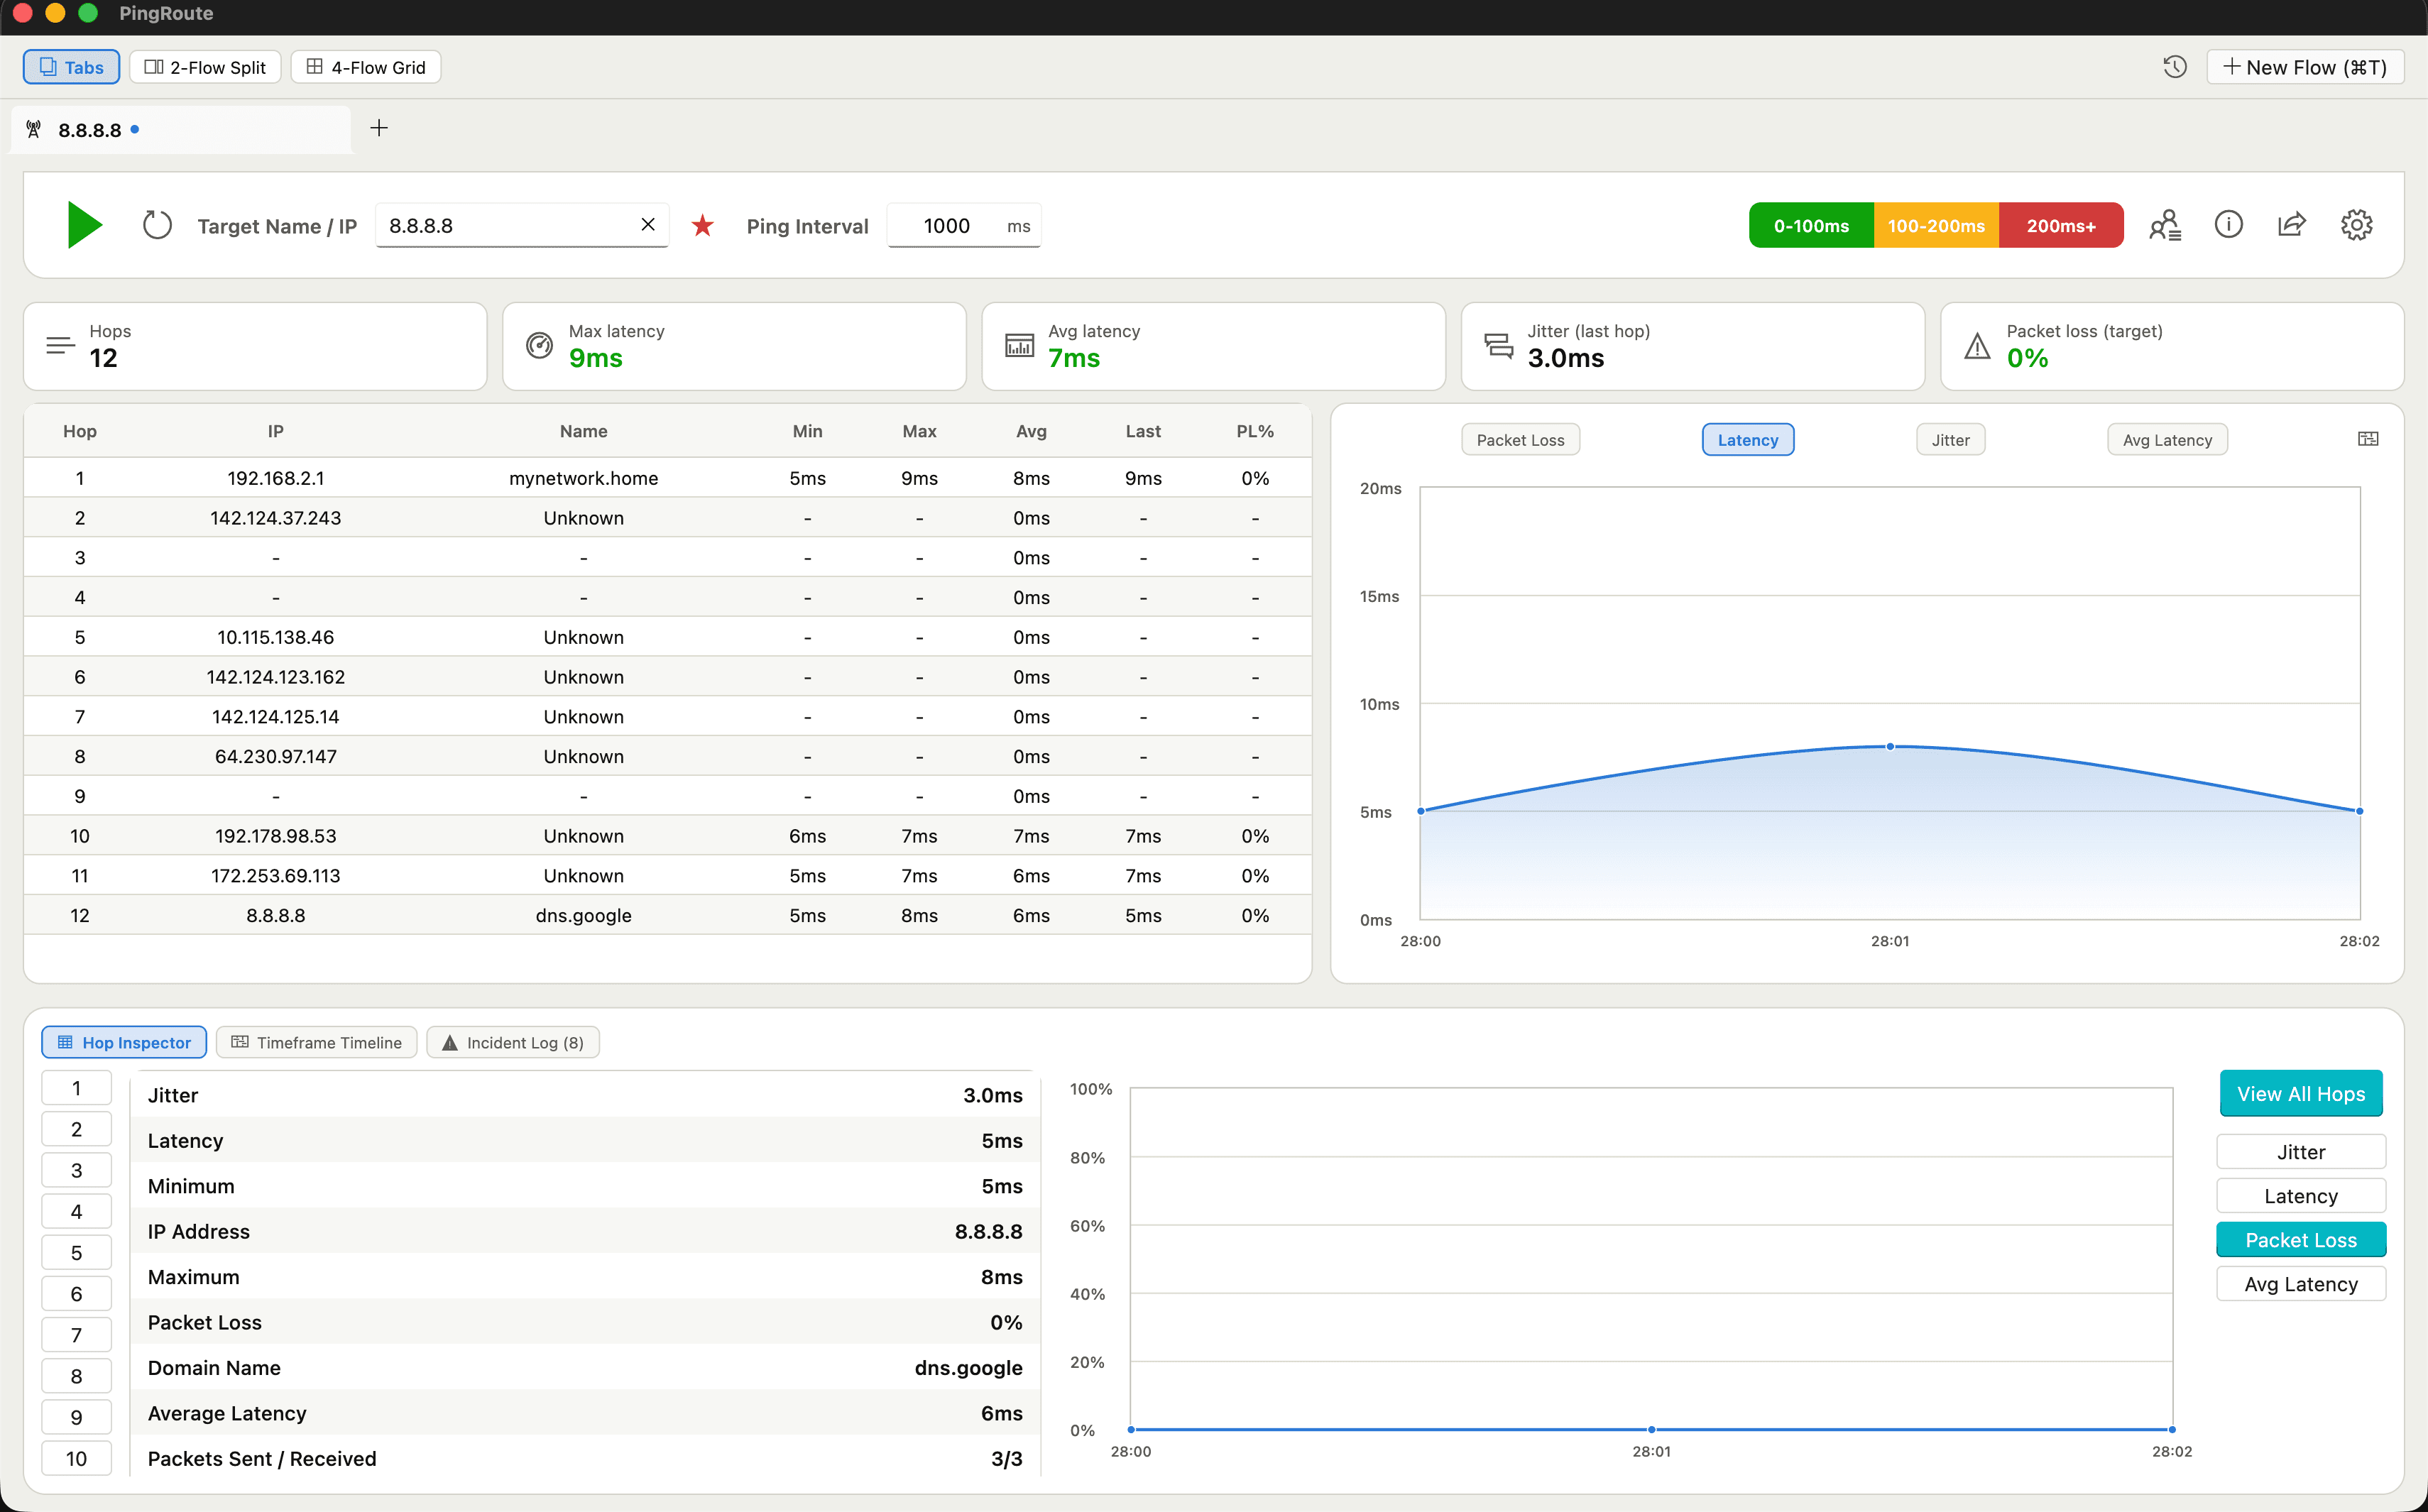
Every hop reports live Min, Max, Avg, Last latency, and Packet Loss %. Click a column header to sort ascending, descending, or reset — IPv4 addresses sort numerically by octet, not as strings, so 10.0.0.1 correctly comes before 172.16.0.1.
Stat Overview Cards
Hop count, max latency, average latency, last-hop jitter, and packet loss are surfaced as cards above the hop table, color-coded so a spike or loss event is visible before you even scan the rows.
Interactive Visualizations
Animated charts track latency, packet loss, jitter, and average latency over time. Switch the active metric per flow and expand any chart to a fullscreen view for a closer look at trends.
Hop Inspector, Timeline & Incident Log
Select any hop number to open the Hop Inspector: jitter, latency, min/max, domain name, and packets sent/received, with a dedicated trend chart. The Timeframe Timeline lets you scrub through a flow's history, and the Incident Log automatically tracks packet loss and latency spike events.
IP Geolocation Lookup
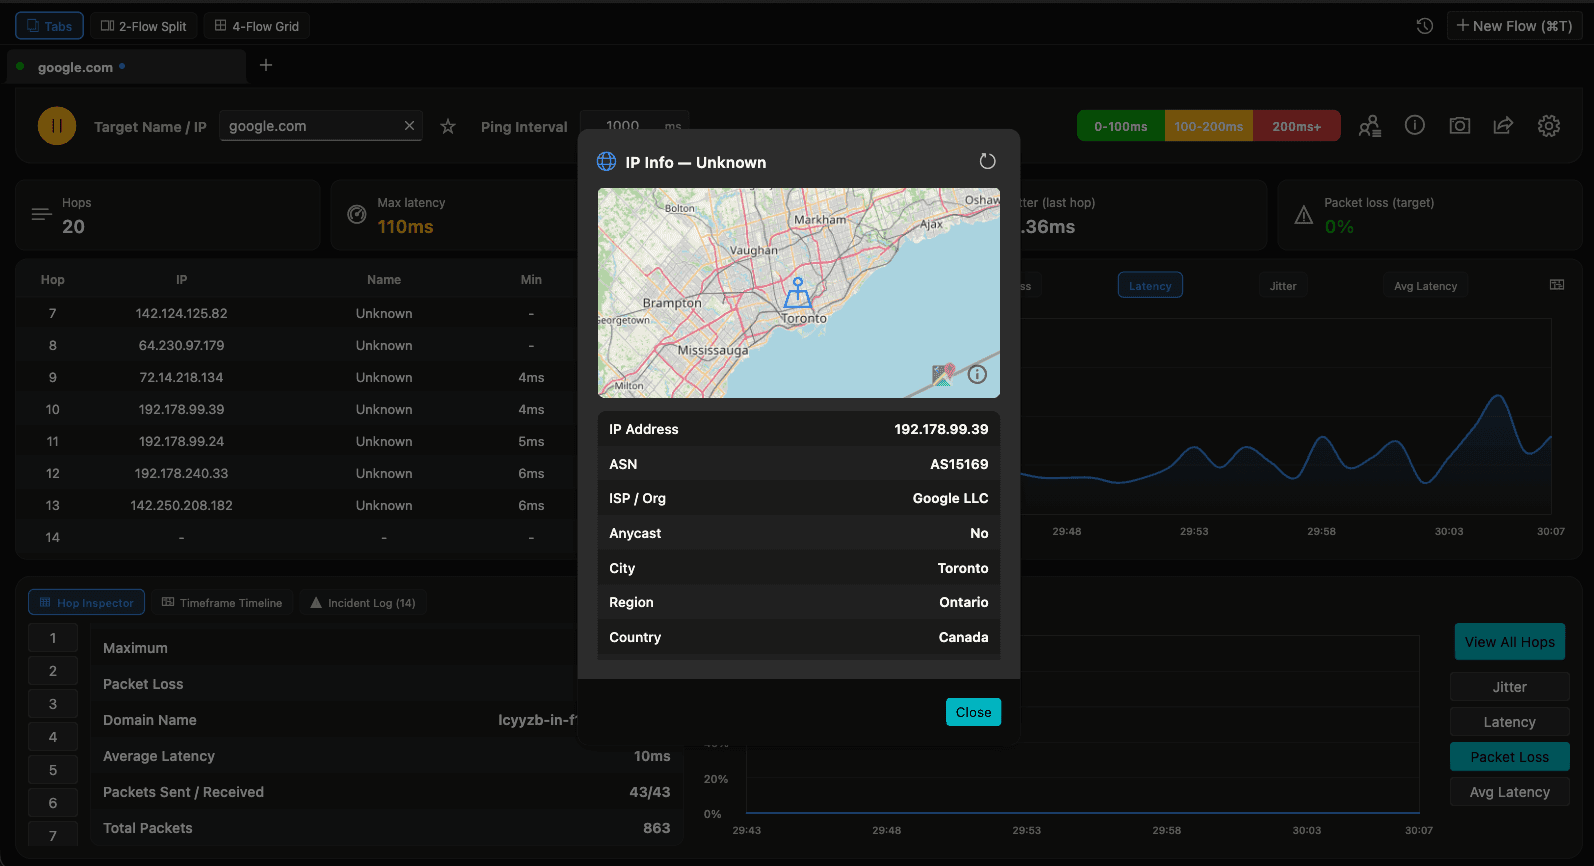
Click a hop's IP to open its IP Info card: a map, ASN, ISP/organization, anycast status, and city, region, and country — resolved without leaving the app.
Target Directory & Quick History
Save frequently tested hostnames and IPs with custom labels and favorite pins. Ping counters and last-tested timestamps help you track what you monitor most, and a LIFO history dropdown makes re-testing instant.
System Diagnostics
One click surfaces active network interfaces, the default gateway, DNS servers, and overall system connectivity — useful context before you even start a trace.
Multi-Format Export & Share
Export telemetry as an MTR-style ASCII report, CSV for spreadsheets, or structured JSON for automated pipelines. Capture and share a snapshot of any flow directly from the toolbar.